Instant
Access to performance insights
90%
Reduction in manual reporting time
Your Way
Access to reporting through dashboards, reports API, or MCP
Flexible analytics options that meet you where you are
Flexible reporting designed around how your team operates. Analyze performance at any level of detail, from executive summaries to SKU-level insights, with views tailored to your goals and decision-making process.
- Reporting by SKU, channel, brand, or business unit
- Executive dashboards and KPI scorecards
- Portfolio, category, and product-level performance views
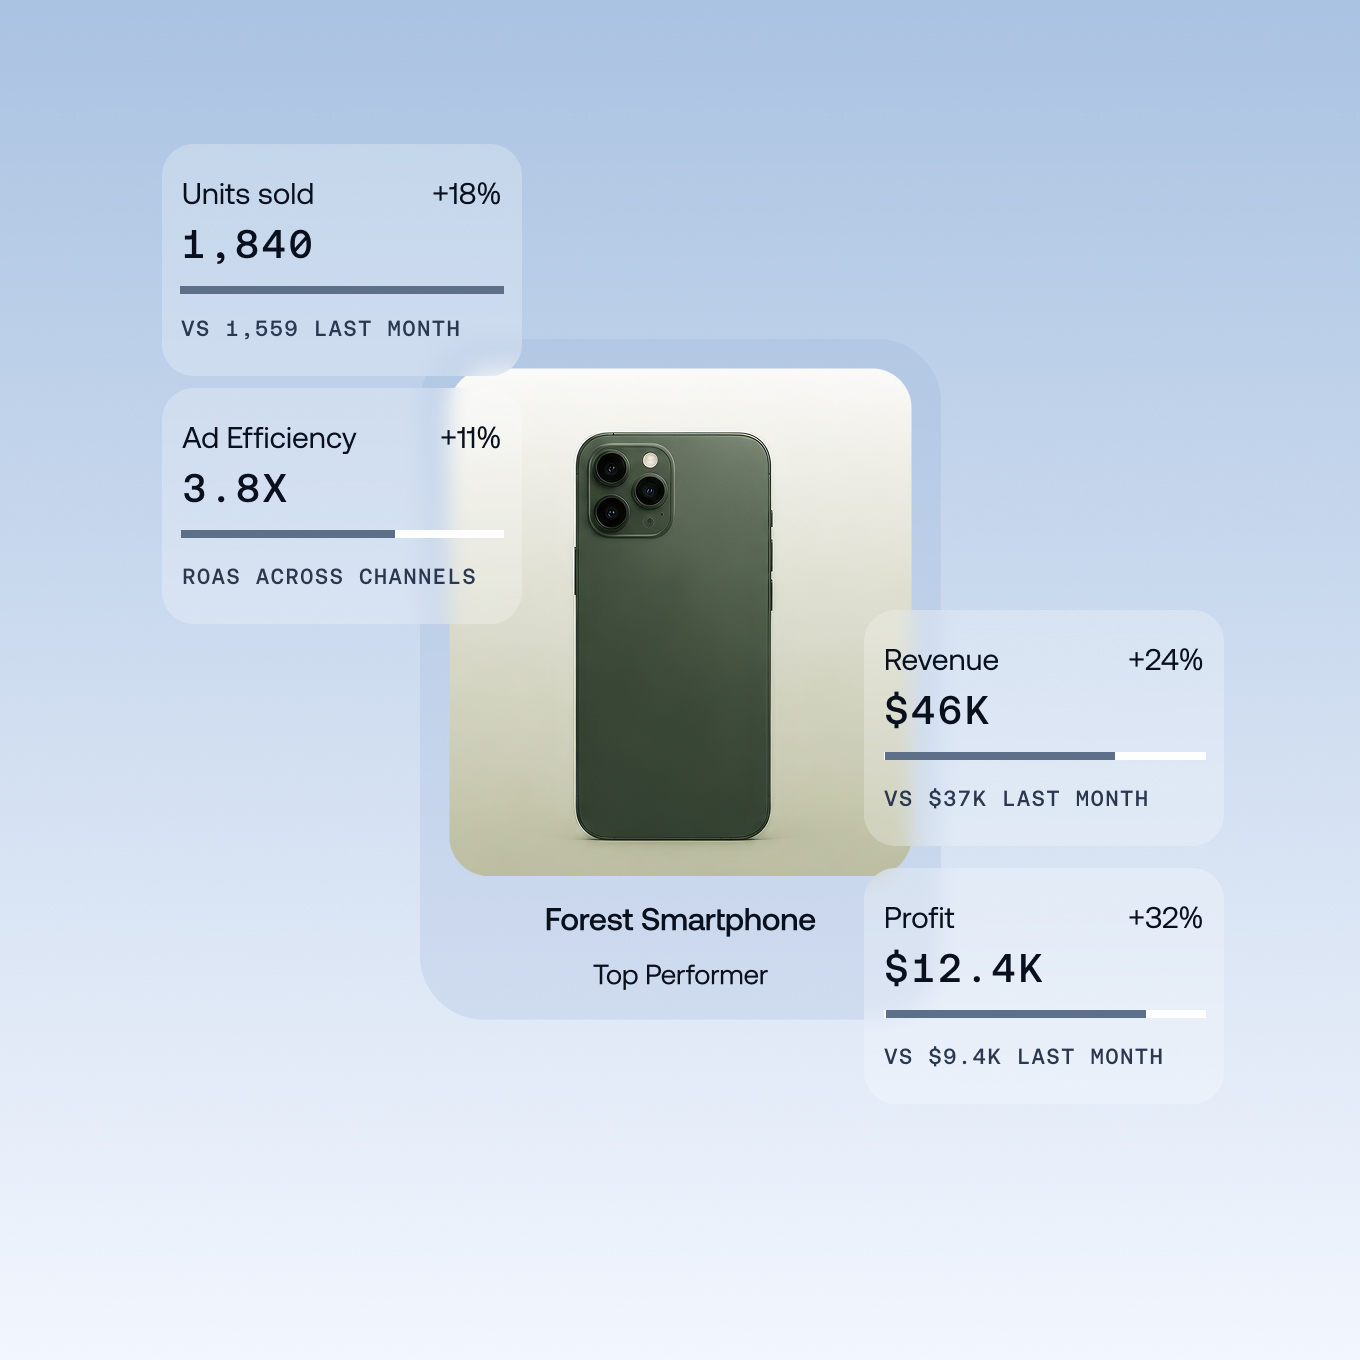
Financial, advertising, pricing, and inventory reporting
Measure performance across financials, advertising, pricing, inventory, supply chain, marketing, and competitive metrics from a single source of truth.
- Financial & profitability reporting
- Advertising, pricing & inventory analytics
- Supply chain & competitive performance metrics
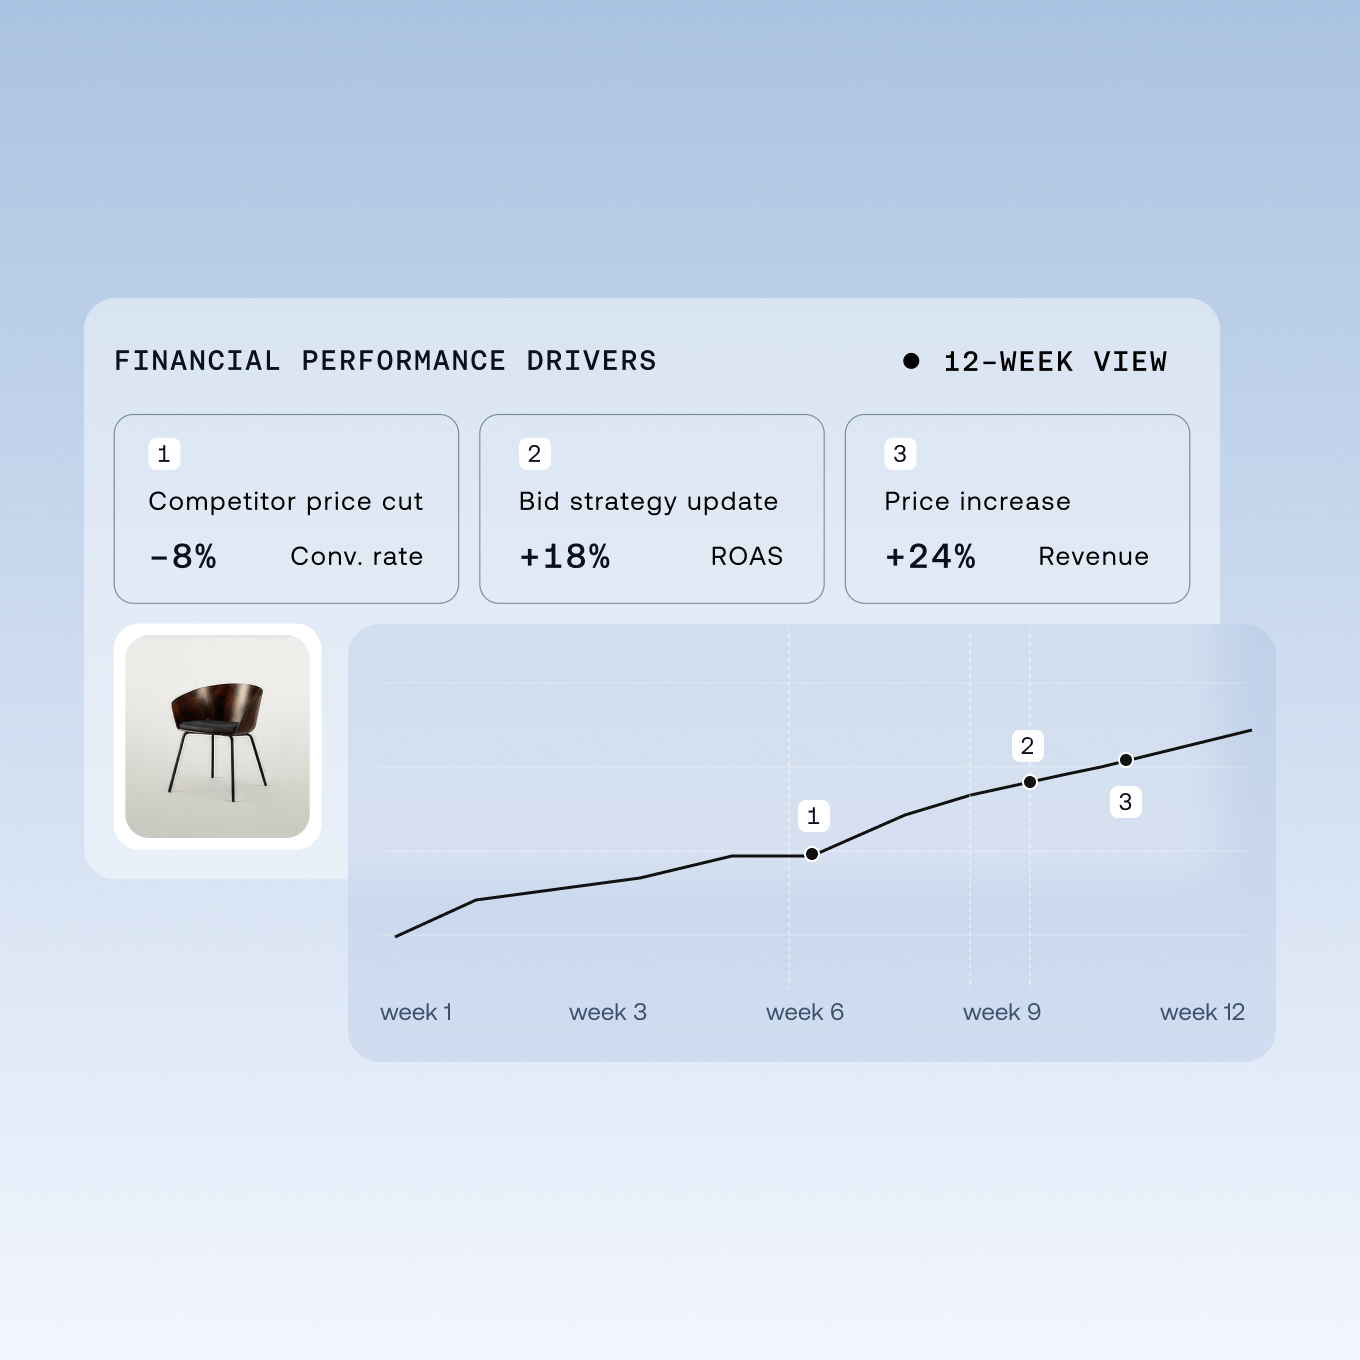
Understand what changed and what to do next
Beyond reporting the numbers, we explain what changed, what caused it, and where to focus next.
- Weekly, monthly, and quarterly business reviews
- Root-cause performance analysis
- Strategic recommendations and action planning
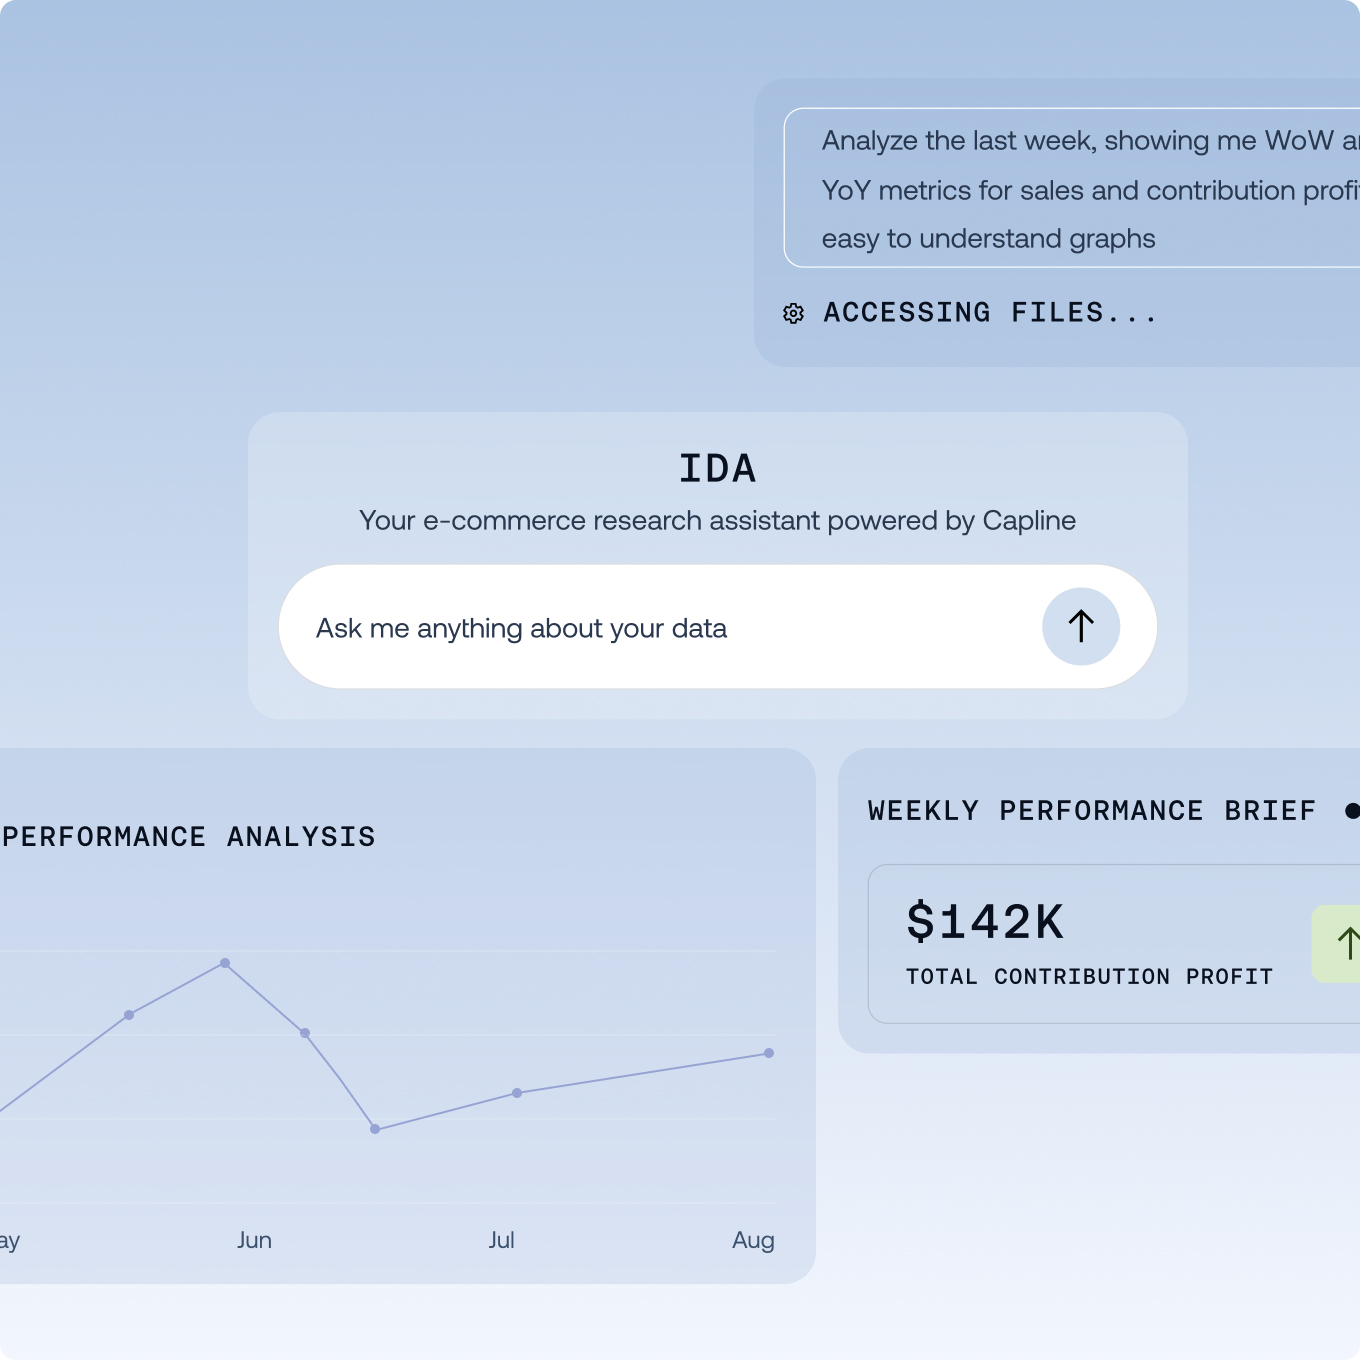
Better decisions.
Stronger outcomes.

Improve business clarity
Reporting stays focused on what’s actually driving product and channel performance.

Reduce reporting complexity
One source of truth for performance, across financials, advertising, pricing, and inventory.

Respond earlier to performance changes
Identify changing trends earlier so operational decisions happen before performance deteriorates.
Select what you need
Advertising
Bids built around product-level margins, conversion efficiency, and bid elasticity so every ad dollar goes where it makes a difference.
Pricing & promotions
Pricing and promotions built around consumer behavior, unit economics, competitive dynamics, and linked to predictable and measurable financial outcomes.
Forecasting
Advanced ecommerce forecasting built around sales trends, planned advertising activity and planned promotions and pricing changes.
All-in-one
Reporting & analytics FAQ
Which ecommerce metrics matter most?
Many brands have easy access to “output” financial metrics like revenue, gross margin, and contribution profit. But understanding the inputs through operational reporting is just as important. Advertising effectiveness, relative price levels, promotional performance, forecast accuracy, and inventory health can point toward the controllable “inputs” that lead to improved financial outcomes.
How do I identify what is driving changes in profit?
Profit changes typically result from a combination of pricing, advertising, conversion rate, product mix, inventory availability, and operational costs. Effective reporting isolates the impact of each variable.
Why do ecommerce teams struggle with reporting?
Data is often spread across marketplaces, advertising platforms, inventory systems, financial tools, and spreadsheets. Consolidating information into a single source of truth improves visibility and decision-making.
What should be included in a weekly business review?
A strong business review includes performance trends, key drivers of change, risks, opportunities, action items, and financial implications across the business.
How can reporting improve decision-making?
Reporting becomes more valuable when it explains why performance changed and what actions should be taken next, rather than simply presenting historical numbers. The Capline system creates causal measurements that drive all decisions, enabling traceability and understanding of change drivers.